This article was originally in the Gini book. However, some people said it was too data-heavy for the book’s general audience. So, the article now lives here.
To begin this case study, let’s examine a snapshot of the U.S. economy because the ideology of Neoliberalism has been most energetic in the United States. If the economic philosophy of Neoliberalism really works, then the U.S. economy and American quality of life should be the most obvious success story. (Note: “Neoliberalism” is an economic philosophy that has nothing to do with political Liberalism. So, this is not a political article. If you’re not sure about the difference between political Liberalism and economic Neoliberalism, please see Economic Liberalism vs. Political Liberalism and Classical Liberalism vs. Neoliberalism.)
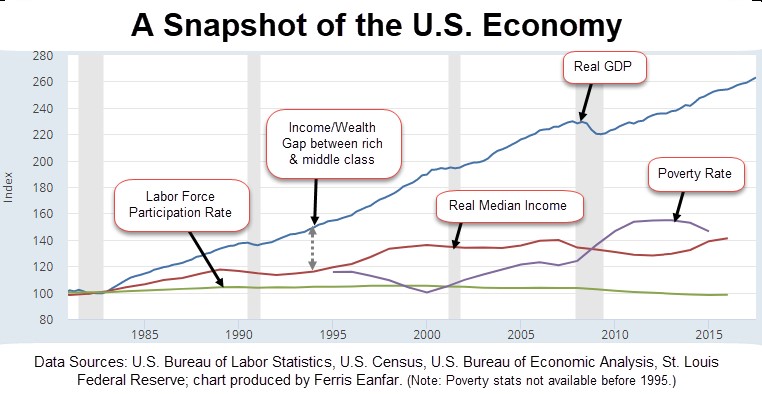
Visualizing the Importance of Sub-National Metrics. Based on the chart above, the U.S. economy seems to be performing well if we only look at the national-level GDP trend line. However, when we scratch beneath the veneer of GDP to examine sub-national metrics, we see a very different picture: The gap between the rich and poor has risen dramatically since the 1980s. Real inflation-adjusted income to the Middle Class has been almost completely flat for decades. The poverty rate has increased significantly since the early-2000s. And the Labor Force Participation Rate has been falling and is at its lowest level in recorded history.
Wealth Concentration Destroys Societies & Economies. Poverty metrics are important, but the concentration of wealth within a society is equally important because wealth concentration destroys the integrity and independence of democratic institutions when financial power can hijack the policymaking systems of government. Additionally, wealth concentration creates cultural divisions within societies, which destroys the social cohesion necessary to preserve peace and civil order. Without peace and social stability, an economy cannot function because global investors and consumers lose confidence in the country’s markets and currency. Thus, wealth concentration, economic and political stability, peace, and prosperity are all interdependent factors in every country.
The Gini Index. This is a common metric used by governments and non-governmental organizations (NGOs) to measure the concentration of wealth in an economy. The Gini Index is typically based on a scale between zero to one: A score of zero means the economy distributes income and/or wealth with perfect equality (i.e., everybody has the same income/wealth) and a score of one means that one person owns 100% of the income/wealth in the economy. In practice, all economies have a Gini Index between 0.2 and 0.75. Countries like Denmark, Sweden, Norway and most European countries have Gini scores in the 0.20-0.30 range. In contrast, the United States, Mexico, and all countries with undemocratic governments have Gini Indexes around 0.5 and higher. The following chart illustrates the growing concentration of wealth in the U.S. **The Law of Constant Wages In the U.S. and U.K., Labor’s average portion of Gross Domestic Income (GDI) historically hovered around 50% for over 100 years until the late 1970s.[1] John Maynard Keynes said the constancy of wages was “one of the most surprising, yet best-established facts in the whole range of economic statistics.”[2] In fact, aggregate wages were so constant throughout the 19th and 20th Centuries that economists gave this phenomenon a name: “Bowley’s Law,” which was named after Arthur Bowley who identified it in his 1937 book, Wages and Income in the United Kingdom since 1860.
The Law of Constant Wages is Broken. The economic turmoil of the 1970s caused by the Vietnam War, President Nixon’s profligate fiscal and monetary policies, and the massive increase in federal spending for President Johnson’s Great Society social programs gave corporate raiders an excuse to lobby Congress for labor, tax, and trade policies that served their interests under the guise of fixing the economy. Those policies—implemented between the 1970s and 1990s under Republican and Democratic administrations—have decimated the American labor force. Breaking Bowley’s Law has predictably devastated the American Middle Class. Now Labor’s share of GDI is hovering around 40%, and is guaranteed to continue falling over the long-run if neoliberal policies are not replaced with a more holistic Smithian approach to capitalism.
Data Source: U.S. Bureau of Economic Analysis, Shares of gross domestic income: Compensation of employees, paid: Wage and salary accruals: Disbursements: To persons [W270RE1A156NBEA]; Federal Reserve Bank of St. Louis.
The trend in the chart above has led to the mountainous wealth gap between American Capital and Labor illustrated in the following chart.
Data Source: U.S. Bureau of Economic Analysis, Federal Reserve Bank of St. Louis.[3] Chart produced by Ferris Eanfar.
If You Can’t Find a Job for 52 Weeks, You Don’t Exist. In 1994, immediately after NAFTA was implemented (a well-known Neoliberal trade agreement), the U.S. Bureau of Labor Statistics (“BLS”) arbitrarily stopped counting “long-term discouraged workers” in the *official *unemployment rate. The BLS’ rationale is that if you haven’t found a job in 52 weeks, then you must not be trying to find work anymore and you should not be counted. And if you work part-time babysitting or mowing a lawn for even a fraction of one day during any 30-day period, the BLS counts you as “employed” and excludes you from the unemployment rate. That logic might work in the minds of Neoliberal politicians trying to make the unemployment rate appear lower after the job-killing NAFTA was passed, but there is no intellectually honest reason to exclude *over 50 million unemployed, able-bodied Americans *from the official unemployment rate today.[4]
Jack Welch & “Bullshit Labor Statistics”.[5] Let’s take the BLS’ abject logic to its logical conclusion: If every human is replaced with robots tomorrow and can’t find a job for 52 weeks, the unemployment rate would fall to zero. The absurdity of the BLS’ unemployment rate methodology is why Jack Welch, the former CEO of General Electric (and infamous Neoliberal), said the way U.S. politicians calculate the unemployment rate today is blatant government manipulation. In fact, it’s so blatantly deceitful that it discredits everything that comes out of the BLS, which is why many otherwise intelligent and thoughtful people around the world today can’t help thinking that “BLS” means “Bullshit Labor Statistics.
The Ongoing, Systemic Lie. According to the BLS, the unemployment rate is only 4.3% (as of mid-2017) and has been allegedly falling for nearly a decade. This data from the BLS is a blatant, ongoing, systemic lie intended to conceal the real condition of the U.S. economy. Sadly, I still see many people citing BLS data to celebrate the fictitious economic recovery and massive equities and bond market bubbles. Anybody who understands how the BLS calculates the unemployment rate knows that the official U3 unemployment rate dramatically overstates the health of the labor force. Both dominant U.S. political parties have embraced these statistical lies since NAFTA was passed in 1994.
The Real Unemployment Rate: Approximately 23%. The unemployment rate during the Great Depression in 1933 peaked at 24.9%. When calculating the unemployment rate today using the same methodology used prior to 1994, the U.S. unemployment rate in mid-2017 is about 23%, which is very close to the Great Depression unemployment rate. For the victims of Neoliberal policies today—including nearly 25% of the unemployed and under-employed American labor force and over 90% of Americans who have no retirement savings and are drowning in debt just to survive—a Depression-level unemployment rate is not surprising.
Deceptive Labor Force Participation Rate Trends. Prior to the 1980s, 50-80% fewer women (depending on the year) were in the U.S. labor force because American households only needed one bread-winner to enjoy a high quality of life during the post-WWII economic boom. That logically means the data associated with women during those years should be adjusted to reflect their participation in the labor force relative to the much smaller population of women that were actually seeking jobs, but BLS’ labor statistics include all working-age women without regard for their actual numbers in the pre-1980s labor force. This results in official charts like the one below, which portray a grossly distorted picture of reality because it makes it seem like today’s labor force participation rate is higher than it was prior to the 1980s. This is another statistical lie.
Contrasting Today’s Rate with the Pre-1980s Rate. Comparing the labor force participation rate prior to the 1980s with the rate today without adjusting for the actual female job-seeking population is like comparing apples to giraffes. The politicians who control the content of BLS reports have self-serving incentives to present the data without explaining the impact of this obvious flaw in their methodology. If women were counted in proportion to the size of the actual job-seeking female population prior to the 1980s, the historical labor force participation rate back then would be approximately 40-50% higher than the rate you see in the chart above. That would provide a much more accurate contrast against more recent trends, which would highlight why the collapsing labor force participation rate today is so alarming.
Today: More Debt, More Job-Seekers, but Fewer Jobs. In contrast to the American labor force prior to the 1980s, today, men and woman (in nearly equal proportion) desperately want/need to work just to survive. Even with two people working in a household, a comfortable modern lifestyle in the U.S. today is only possible by going into debt for over 90% of the American population. In fact, Americans are now in more debt today than they were before the 2008 financial crisis.[6] This is one of the many adverse consequences of Neoliberal economic policies.
Responding to Defenders of Systemic Fraud. I see many so-called experts in the mainstream media today parroting these official BLS stats like unconscious zombies, which magnifies the confusion for the general public. Worse, the so-called experts attack anybody who questions the official BLS reports with asinine straw-man arguments like, “So, you really think Trump/Obama/Bush/Clinton personally called the BLS and told them to cook the numbers just before an election?” No, that’s not how this fraud is perpetrated. It’s a systemic fraud based on the deliberately deceptive formula that the BLS has been using to calculate the “headline” unemployment rate since NAFTA was passed in 1994. And the fraud continues because U.S. politicians have distorted incentives to perpetuate the delusions embedded within the Neoliberal economic policies that are destroying Capitalism and driving the global economy off a cliff.
Re-empowering Labor Unions is Not a Sustainable Solution. Many Labor rights activists believe the problem is merely an imbalance of power. They’re often too young to remember how powerful labor unions actually were prior to the 1980s. The socioeconomic reforms implemented after World War II and during the 1960s gave labor unions unprecedented political influence over American economic policy. This is why the previous “Labor’s Share of Gross Domestic Income” chart shows Labor’s share of national income above 50% prior to the 1970s. In fact, labor unions successfully pushed corporate shareholders below the equitable 50/50 share of Gross Domestic Income almost every year after World War II. Labor unions became so powerful that former Federal Reserve Chairman, Arthur Burns, said in 1972:
The hard fact is that market forces no longer can be counted on to check the upward course of wages and prices even when the aggregate demand for goods and services declines in the course of a business recession. During the recession of 1970 and the weak recovery of early 1971, the pace of wage increases did not at all abate as unemployment rose. . . . The rate of inflation was almost as high in the first half of 1971, when unemployment averaged 6 percent of the labor force, as it was in 1969, when the unemployment rate averaged 3 1/2 percent. . . . Cost-push inflation, while a comparatively new phenomenon on the American scene, has been altering the economic environment in fundamental ways. . . . If some form of effective control over wages and prices were not retained in 1973, major collective bargaining settlements and business efforts to increase profits could reinforce the pressures on costs and prices that normally come into play when the economy is advancing briskly, and thus generate a new wave of inflation. If monetary and fiscal policy became sufficiently restrictive to deal with the situation by choking off growth in aggregate demand, the cost in terms of rising unemployment, lost output, and shattered confidence would be enormous. (Burns 1978)
The Real Reason Reagan Crushed the Unions. At the height of their power, labor unions were just as greedy as the neoliberals that control the largest corporations today. Republicans and many Democrats in the 1970s were genuinely afraid of the negative inflationary impact that the unions were having on the economy. Even before Nixon hammered the final nail in the coffin of the Gold-Exchange Standard in 1971, inflation had been rising for years and was already at 16%. When the OPEC oil embargo hit the U.S. economy in late 1973, inflation was already at 10%. The embargo only lasted five months, but inflation continued to rise throughout the 1970s. Virtually all mainstream economists of that era believed the labor unions were a major factor in the rising inflation and unemployment because they were pushing up GDI beyond the historical 50/50 ratio, which was not in the best interest of the broader economy.[7] This led to President Reagan’s extreme response in the 1980s to do everything possible to crush the unions.[8]That caused the pendulum to swing too far in the opposite direction, giving neoliberals far too much power today.
U.S. Protectionism Reveals the Hypocrisy of Neoliberalism. In the late 1700s, Alexander Hamilton, the first U.S. Treasury Secretary, was the first American statesman to formally define and adopt the “Infant Industry Argument” to protect the infant American economy from being dominated by the more powerful European countries. In fact, the USG did not begin to eliminate its broad-based trade protection policies until the late 1800s, over 100 years after the U.S. Declaration of Independence. Today, the USG still imposes over 12,000 tariffs and quotas across a wide variety of industries as part of an incoherent patchwork of politically-motivated, special-interest-driven trade barriers, which often resemble the mercantilist policies that Adam Smith despised.[9] The radical free-market jihad of the Neoliberal Washington Consensus is a case of “do as we say, not as we do.”
The USG Preaches Neoliberalism While Practicing Neomercantilism. After analyzing all the sub-national metrics above, it’s now time to recognize a basic truth: Outside of its labor policies and selective compliance with WTO trade rules, the USG rarely follows its own Neoliberal Policy Package. In fact, U.S. policymakers have adopted a distorted, half-baked form of Keynesianism to conceal all the problems associated with the Neoliberal trade and labor policies that have decimated the American Middle Class. The outcome of this hodgepodge of economic and trade policies is neo-mercantilism, which is intended to maximize the exploitation of other nations, maximize U.S. GDP, centralize control over all capital and wealth, maximize the flow of wealth to owners of capital, and minimize the flow of wealth to workers in the U.S. and worldwide.
The Neoliberal-Keynesian Frankenstein Economy. The USG is now perpetually stuck in the deficit-spending phase of Keynes’ counter-cyclical macroeconomic policy framework, while never implementing the surplus-tightening phase of his framework. This is the worst of both worlds: People unfamiliar with the mechanics of Keynes’ counter-cyclical framework often incorrectly assume the USG’s perpetual budget deficits are a defect of Keynesianism; and the global humanitarian problems associated with Neoliberalism fester beneath the conscious awareness of most Americans because the U.S. economy can temporarily indulge in the exorbitant privilege of having the world’s reserve currency. This enables U.S. politicians to avoid the fiscal and monetary accountability that they impose upon all other countries, but not for much longer.
Understanding the U.S. Economy Helps Us Understand All Economies. Dynamics in the U.S. economy are often leading indicators of what other countries can expect in the future because issues that originate in the U.S. economy usually spread and impact the entire global economy. After observing the dramatic contrast between sobering sub-national metrics and the rosy impression created by focusing on national-level GDP alone, it’s easier to appreciate how other countries suffer from similar sub-national human welfare problems, *even if *their GDP performance appears strong on the surface. With these insights, it’s easier to understand why Neoliberalism is so out of touch with the reality of billions of real humans suffering in the real global economy today.
Notes:
[1] Some economists may be familiar with the Cobb-Douglas 1929 (March) research paper, “A Theory of Production,” in which they said Labor’s aggregate share of GDP was approximately 75%. They are using Gross Domestic Product (GDP); whereas I’m using Gross Domestic Income (GDI) because it provides a more appropriate and reliable long-term benchmark. Most importantly, the differences between these two benchmarks are merely statistical measuring discrepancies; these discrepancies cannot lead to any actual differences in the final outcome of a 50/50 distribution of income between Capital and Labor at the individual company nor at the aggregate economy levels.
[2] Keynes, John Maynard 1939. “Relative Movements of Real Wages and Output”. The Economic Journal. 49 (193): 48. JSTOR 2225182.
[3] This data set includes all forms of worker compensation, including employer-funded 401Ks, pensions, healthcare benefits, etc. So anybody who says “The wealth gap doesn’t take benefits into account. . . .” doesn’t know what they’re talking about or they’re a partisan political operative.
[4] The BLS indicates that approximately 35% of the entire U.S. adult population “do not want a job now,” which is how they justify excluding over 90 million adults from their definition of the “Civilian Labor Force.” However, in their footnotes, they state, “Includes some persons who are not asked if they want a job,” which means they arbitrarily assume that approximately 90 million adults don’t want jobs. Of course, that’s an absurd assumption and ignores many economic policy factors that discourage millions of Americans from working. So, my definition of the “Civilian Labor Force” reasonably counts a significant portion of those 90 million erased humans, including significant subsets of the long-term discouraged/displaced population, college student population, over-age-65 population, non-severe disabled population, all of which are able to perform many jobs.
[5] More specifically, discouraged/displaced humans don’t magically disappear in real life; so they should be counted. Many students would prefer to earn additional income to reduce their asphyxiating student loan debt if there were available low-skill jobs. Many healthy people over the age of 65 need to work because their retirement savings and benefits are insufficient to sustain a comfortable retirement, but they can’t find jobs. And a majority of the officially disabled population are not severely disabled; thus, they would be able to work if jobs were readily available to them.
[6] LaMagna, M. 2016. Americans are now in more debt than they were before the financial crisis. Retrieved February 14, 2017, from http://www.marketwatch.com/story/this-is-how-much-credit-card-debt-americans-racked-up-in-2016-2016-12-20
[7] To learn more about this phenomenon, see: Hetzel, Robert L. “Arthur Burns and Inflation.” Richmond Federal Reserve Bank, 1998. https://papers.ssrn.com/sol3/papers.cfm?abstract_id=2126277. Also see: Ferrell, Robert H., ed. Inside the Nixon Administration: The Secret Diary of Arthur Burns, 1969-1974. 1st edition, Edition. Lawrence, Kan: University Press of Kansas, 2010.
[8] The same battle between Prime Minister Thatcher and labor unions occurred in the U.K. at the same time.
[9] The U.S. International Trade Commission (ITC) maintains a “Harmonized Tariff Schedule of the United States”—approximately 4,000 pages long—of over 12,000 specific tariffs that the U.S. Government imposes on foreign imports, many of which exceed 100% of the MSRP.